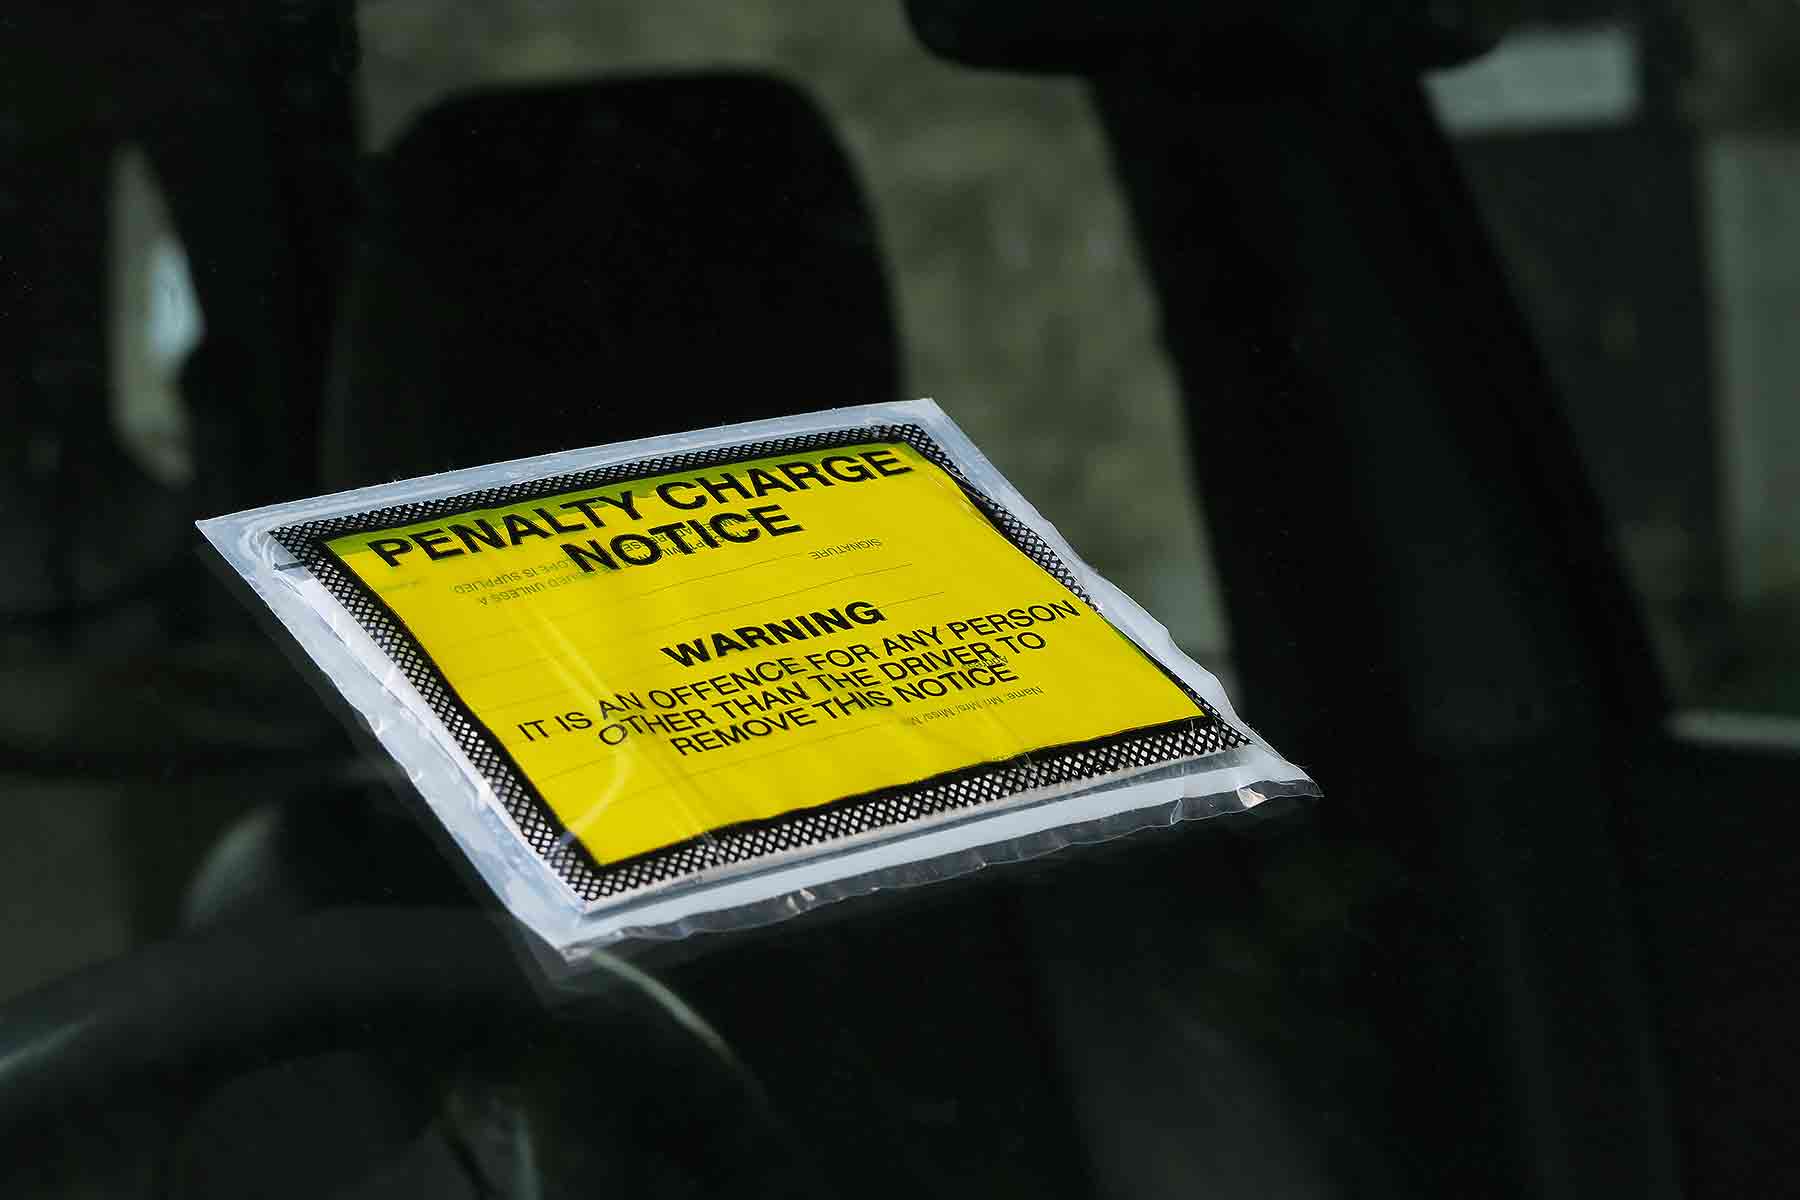
 A record 5.65 million tickets were issued to drivers parking on private land in the last financial year – a staggering increase of almost one million penalties over 2016/17 figures (which themselves were a record).
The rapid increase in parking penalties has been highlighted by RAC Foundation analysis – and as charges can be as much as £100, the association calculates British motorists could be spending more than half a billion pounds a year simply on private parking fines.
It’s a stark contrast to just a decade ago, where less than half a million parking tickets were issued. In 2006/07, a mere 272,000 tickets were handed out.
The ticket tally equates to 15,486 penalties being issued every single day. The RAC Foundation has calculated its data from the purchase of driver data from the DVLA; by far the biggest purchaser was ParkingEye Ltd, which bought 1,768,233 records in 2017/18; Euro Car Parks bought 406,323 records and Smart Parking Ltd paid for 390,860 records.
A total of 119 parking companies paid for data from the DVLA.
Steve Gooding, director of the RAC Foundation, said: “Each year we publish this analysis and each year we are not only astonished by the numbers involved, but also by the fact that those numbers keep rocketing up.
“Pursuing so many people must be a major administrative task for the companies involved, but the questions the numbers really beg are: what’s going wrong? Are Britain’s motorists really flouting the rules on such an industrial scale?”
But why are there so many parking tickets now being issued? The RAC Foundation points to the 2012 Protection of Freedoms Act, which banned clamping on private land except in ‘exceptional circumstances’.
The Act instead allowed private parking companies to go after the registered owners of vehicles themselves, instead of proving who the driver was at the time of the so-called offence – hence, as the figures below show, the incredible rise in parking tickets being issued…
| Financial year | Vehicle keeper records obtained from the DVLA by parking companies |
| 2017/18 | 5.65 million |
| 2016/17 | 4.71 million |
| 2015/16 | 3.67 million |
| 2014/15 | 3.06 million |
| 2013/14 | 2.43 million |
| 2012/13 | 1.89 million |
| 2011/12 | 1.57 million |
| 2010/11 | 1.17 million |
| 2009/10 | 1.03 million |
| 2008/9 | 687,000 |
| 2007/8 | 499,000 |
| 2006/7 | 272,000 |
| TOTAL | 26.64 million |