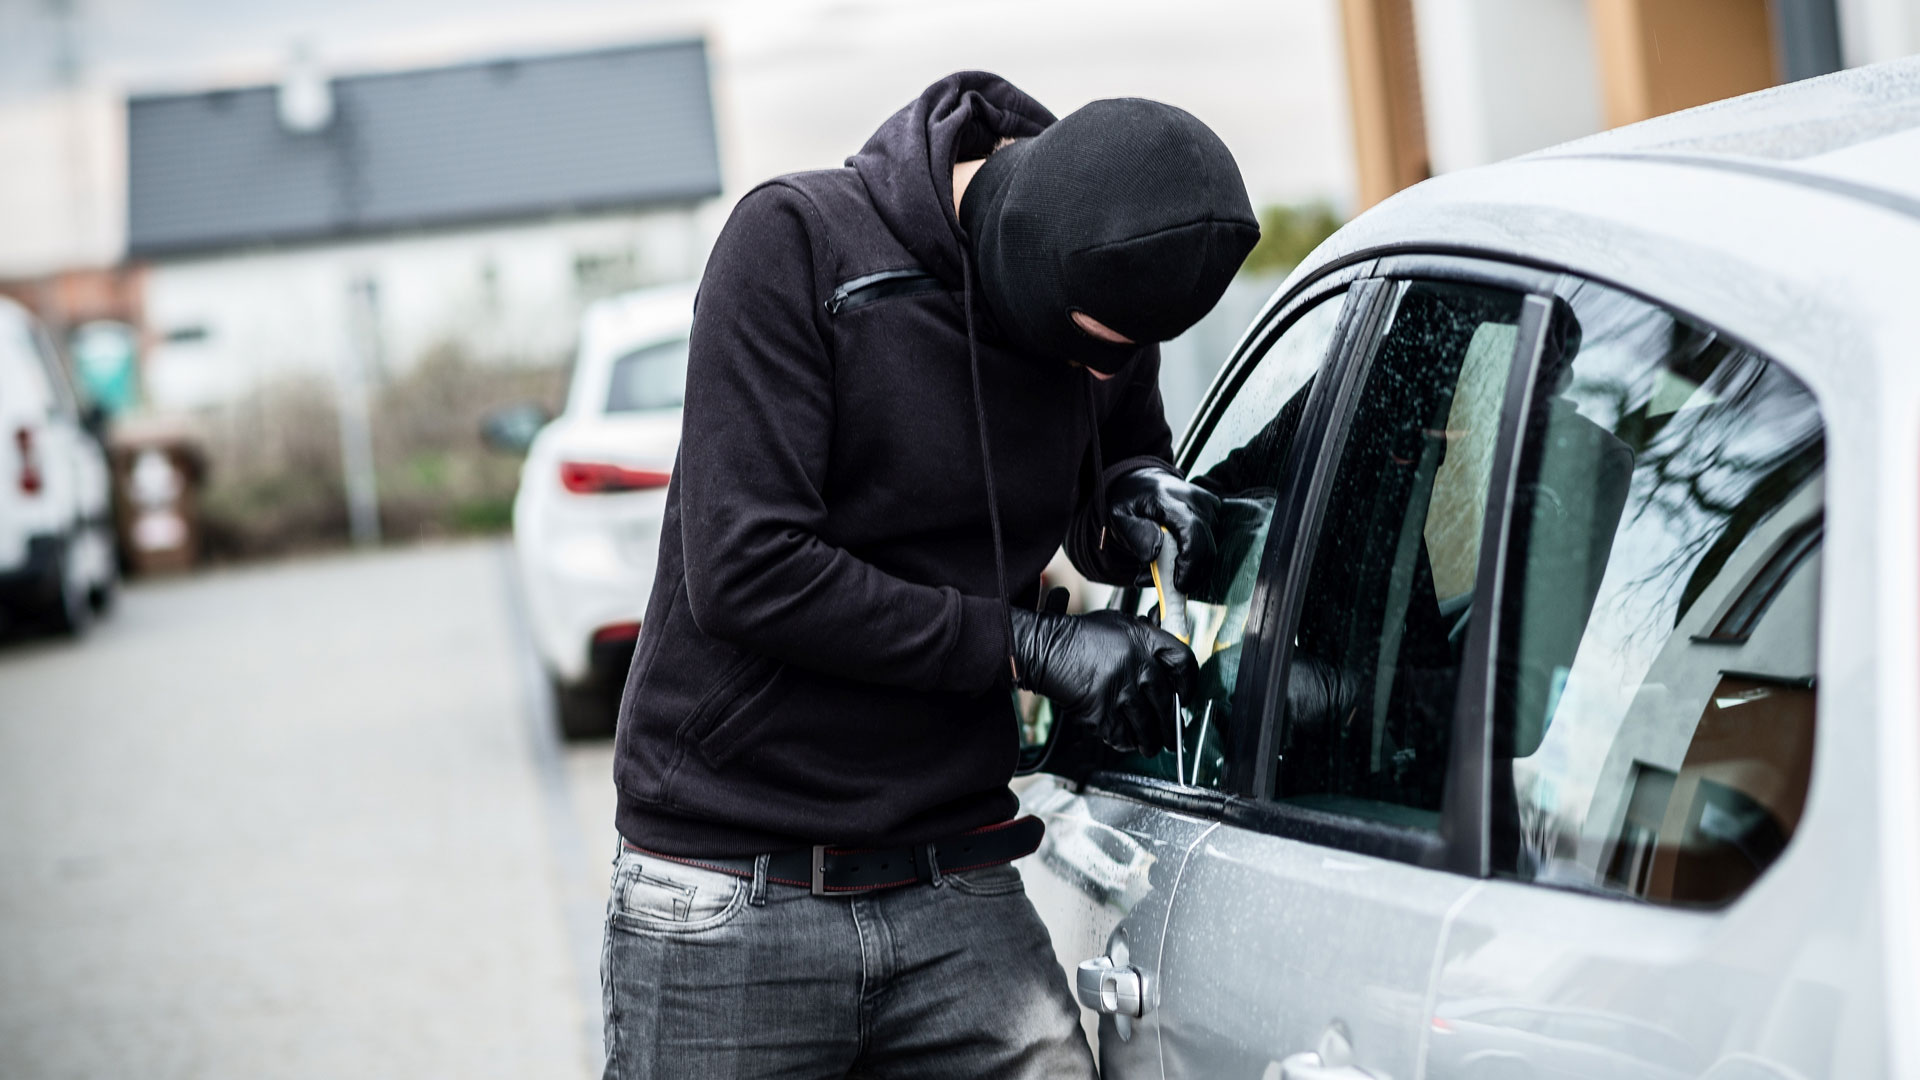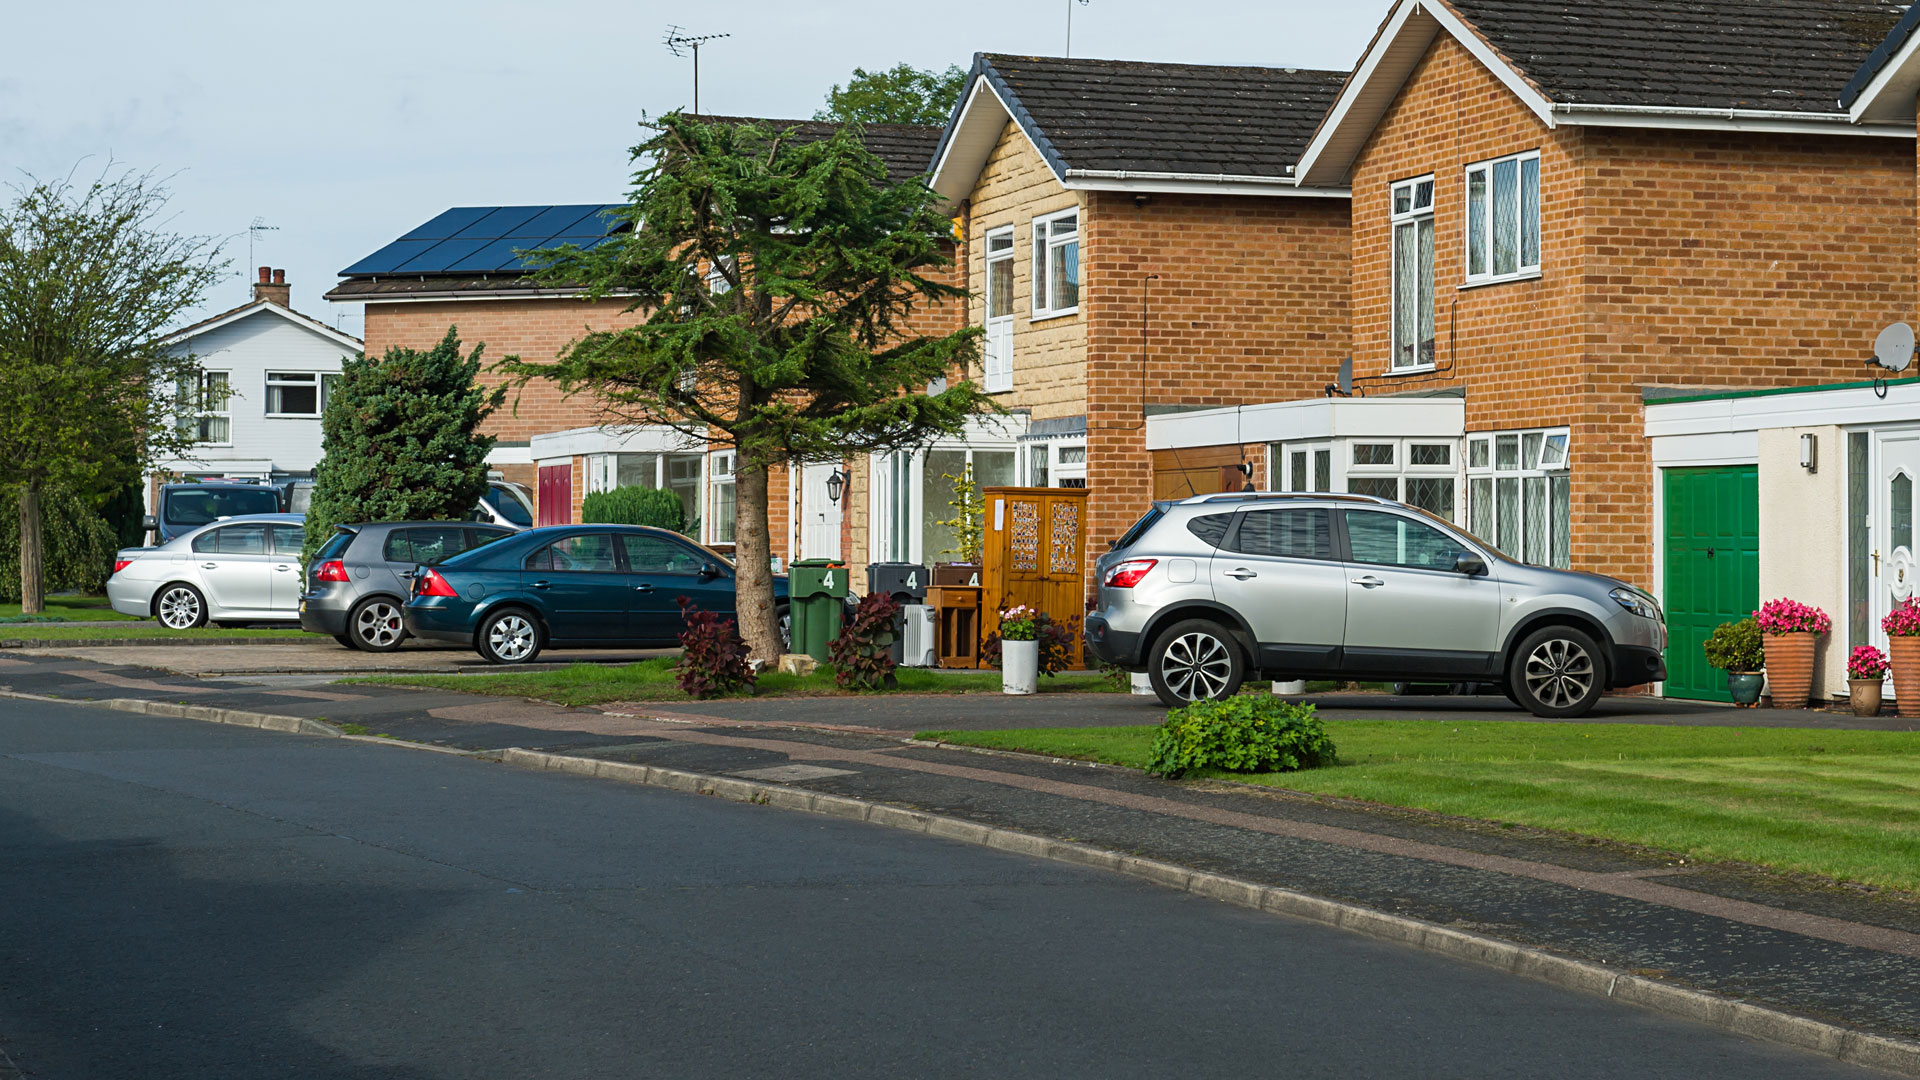
Perhaps predictably, London has been named car crime capital of England by aftermarket towbar specialist Ixplor, with North Yorkshire identified as the safest region.
Using statistics from data.police.uk, the team at Ixplor ranked each area according to the number of reported vehicle crimes and the population of each region. This created a table of ratios, placing the City of London and Greater London at the top.
The West Midlands is named as the hotspot outside of London, with vehicle crime affecting one in every 78 motorists in a region of 2.9 million residents. In comparison, the figure for the City of London is one in 36, while in Greater London it’s one in 72.
Bedfordshire and Manchester completed the top five, but there’s better news for some of England’s more rural locations.
With a vehicle crime ratio of one in 461, North Yorkshire is the safest place, followed by Cumbria, Lincolnshire, Cheshire and Norfolk.
How your postcode affects your premium

According to comparethemarket.com, 90 percent of all car insurance claims occur within five miles of the driver’s home, which is why the policyholder’s postcode plays a big role in calculating the annual premium. The number of personal accident claims made by drivers in an area, along with the number of uninsured drivers and instances of fraudulent claims, theft and vandalism.
Last year, the price comparison site drilled down on insurance data to reveal the towns and cities considered to represent the highest and lowest risk.
Mirroring the Ixplor data, comparethemarket.com named Bradford, Oldham, Manchester, Liverpool, Birmingham as hot spots, with Redruth, Penzance, East Inverness, Angus and Isle of Barra revealed as the safest locations.
The ten MOST affected areas for car crime
| Pos. | Region | Ratio |
| 1. | City of London | 1 in 36 |
| 2. | Greater London | 1 in 72 |
| 3. | West Midlands | 1 in 78 |
| 4. | Bedfordshire | 1 in 85 |
| 5. | Manchester | 1 in 88 |
| 6. | West Yorkshire | 1 in 95 |
| 7. | Northampton | 1 in 99 |
| 8. | South Yorkshire | 1 in 110 |
| 9. | Leicestershire | 1 in 111 |
| 10. | Warwickshire | 1 in 114 |
The ten LEAST affected areas for car crime
| Pos. | Region | Ratio |
| 1. | North Yorkshire | 1 in 461 |
| 2. | Cumbria | 1 in 420 |
| 3. | Lincolnshire | 1 in 358 |
| 4. | Cheshire | 1 in 327 |
| 5. | Norfolk | 1 in 318 |
| 6. | Devon and Cornwall | 1 in 292 |
| 7. | Durham | 1 in 264 |
| 8. | Wiltshire | 1 in 250 |
| 9. | West Mercia | 1 in 217 |
| 10. | Suffolk | 1 in 206 |